Reference explainer
Tornadoes
Status: Clear Consensus
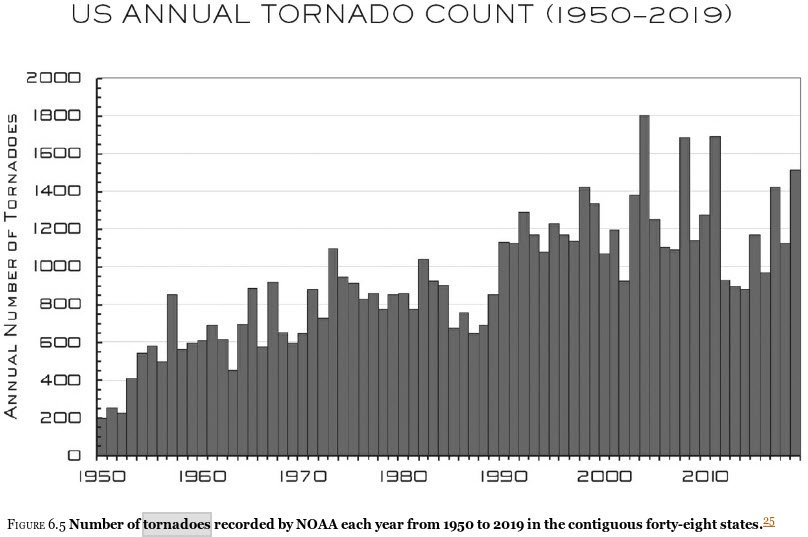
NOAA (1950-2019)
It’s easy to be fooled by the data, if you don’t know what to look for. The chart of all tornadoes from 1950-2019 would suggest tornadoes are becoming more frequent.
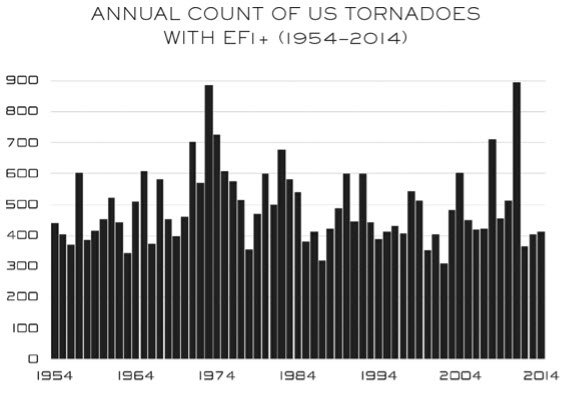
EF1+ (1954-2014)
Since the 1950s, weather detection systems have become far better at detecting EF0 and EF1 tornadoes. Thus, increasing the total number. Once filtered out, there is no discernable trend. If anything, they are decreasing in frequency.
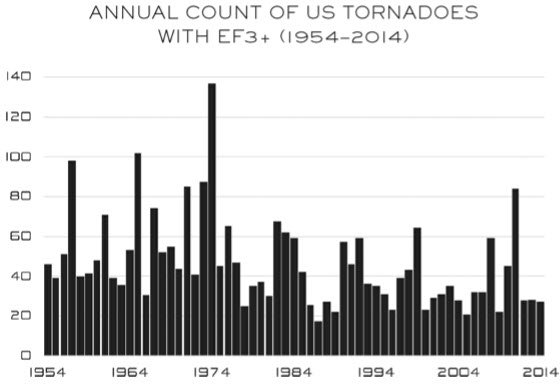
EF3+ (1954-2014)
Among stronger storms, there is a slight decrease in frequency.
“Fortunately, human-warmed climate isn’t making violent U.S. tornadoes any more frequent. ”
“Although the world has already seen around 1.1-1.2 degrees of warming, American tornadoes have not in fact become more common; there is no discernable trend in their frequency”
“There is low confidence in projections of small-scale phenomena such as tornadoes because competing physical processes may affect future trends and because climate models do not simulate such phenomena”
From the original reference page at www.hefner.energy. Charts retain their original date ranges.
Return to The Science →