Reference explainer
Sea Level Rise

Status: Clear Consensus
Science
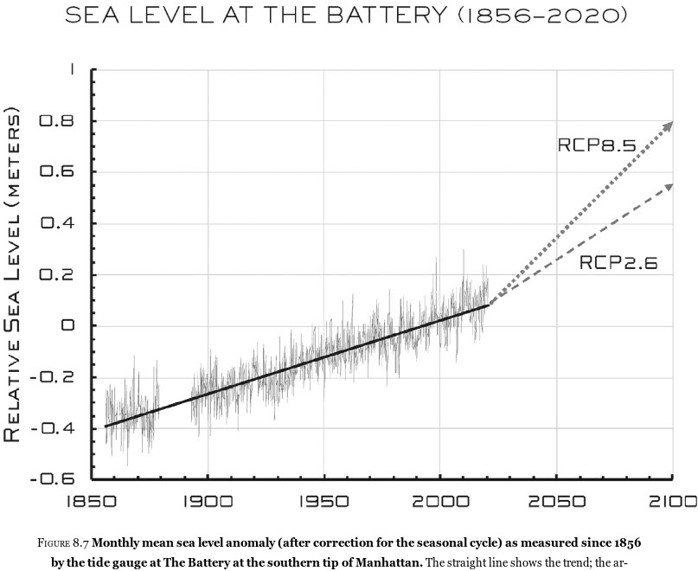
1856-2020
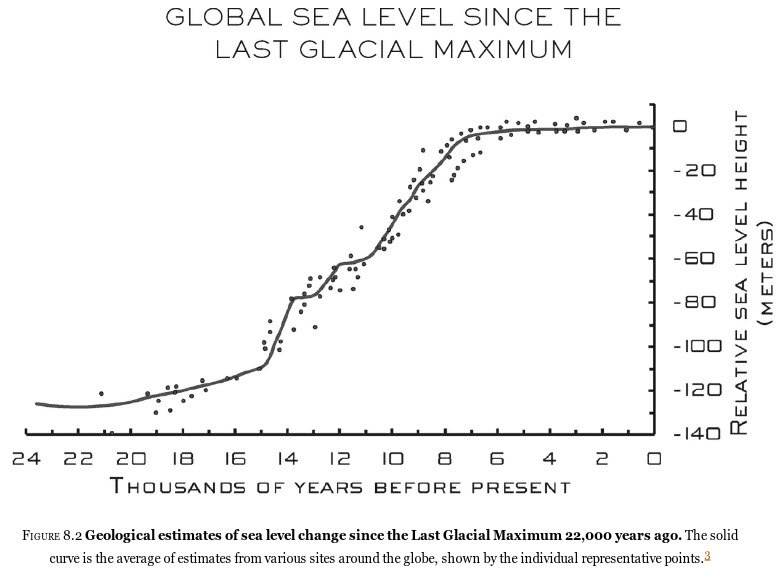
Global sea level rise has averaged under 3 millimeters per year for the last 7,000 years.
It would take 100 years for sea levels to rise 12 inches.
Clickbait

24,000 Years
Global sea level rise has averaged under 3 millimeters per year for the last 7,000 years.
It would take 100 years for sea levels to rise 12 inches.
Ice Melt
What happens when ice melts in water? Watch the video.
From the original reference page at www.hefner.energy. Charts retain their original date ranges.
Return to The Science →